After covering how to install Zabbix, it’s time to learn how to Monitor pfSense with Zabbix! Gladly, the process is really easy and I’ll guide you through it, step-by-step.
Table of Contents
- Step 1 – Installing the Zabbix Agent on pfSense
- Step 2 – Configuring Zabbix Agent on pfSense
- Step 3 – Adding Firewall Rules
- Step 4 – Adding pfSense to Zabbix
- Step 4 – Monitor pfSense with Zabbix
- Conclusion
Step 1 – Installing the Zabbix Agent on pfSense
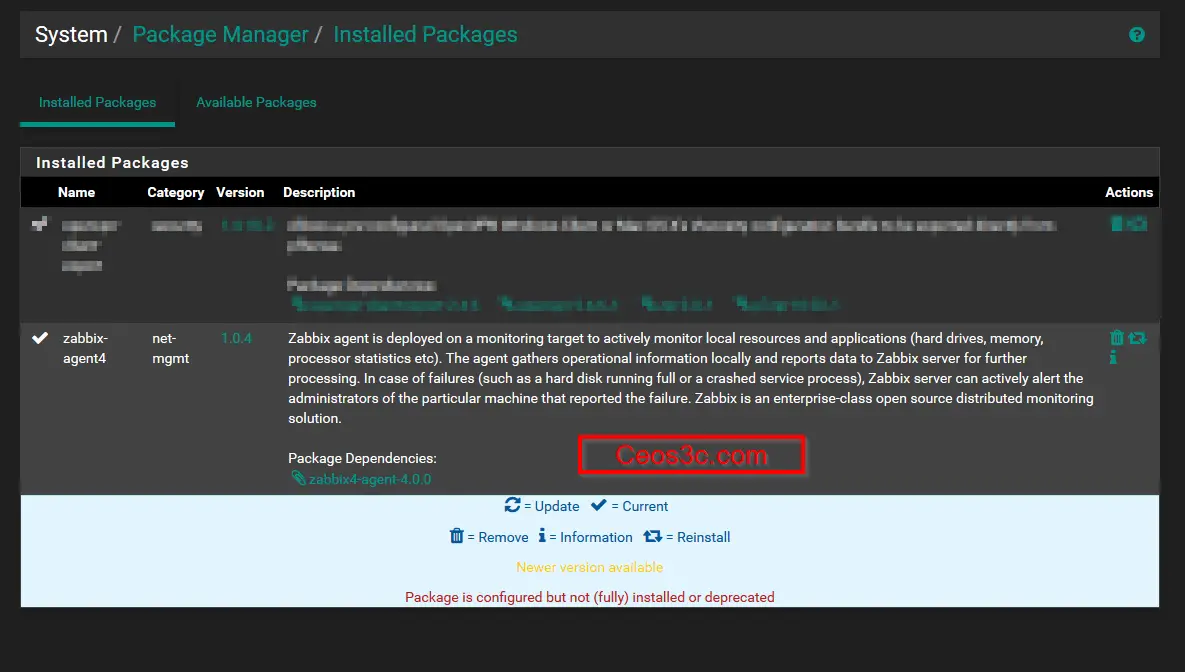
Log in to your pfSense firewall and navigate to System -> Package Manager -> Available Packages. Put Zabbix in the search field and hit enter. Now you will be presented with a couple of different Zabbix-Agent versions. You need to choose the one that fits your Zabbix version. If you run Zabbix 4.0, choose zabbix-agent4. Install it.
Step 2 – Configuring Zabbix Agent on pfSense
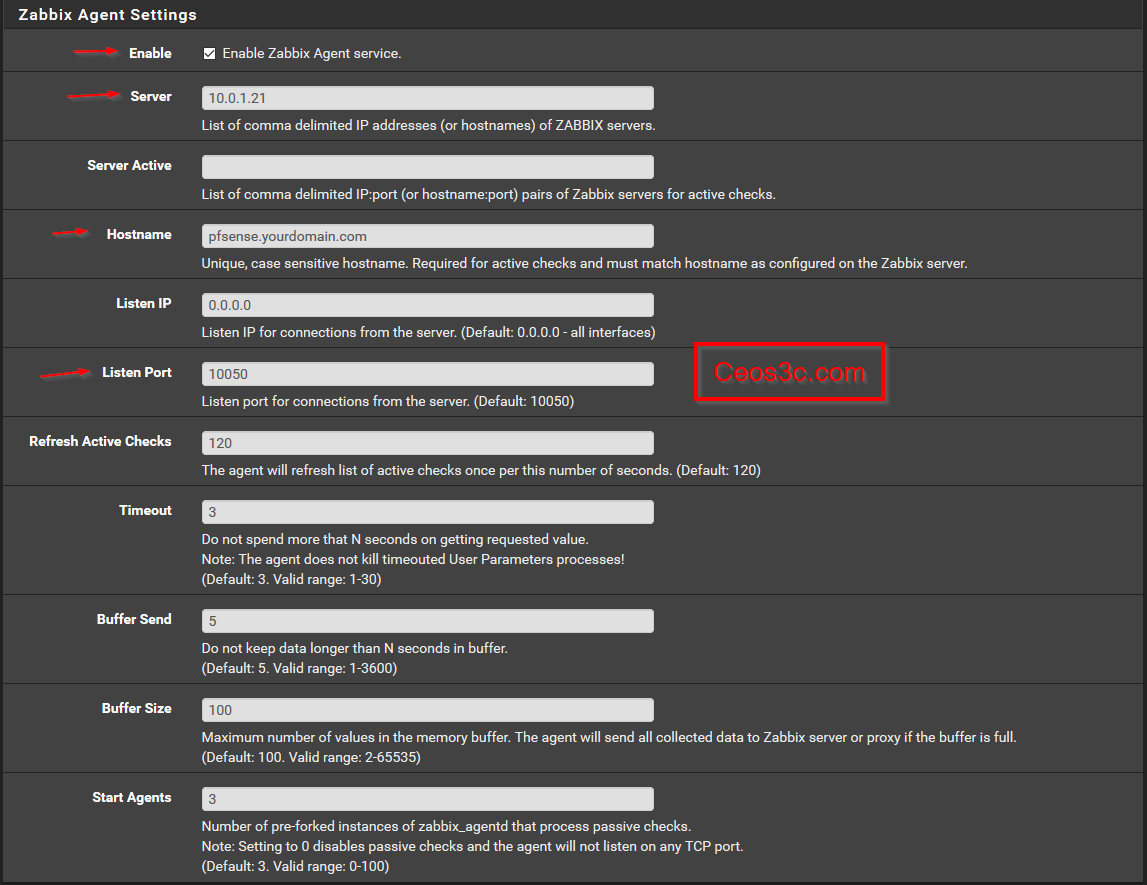
Next, we need to configure our Zabbix Agent and point it to our server. Navigate to Services -> Zabbix Agent. Check the Enable Zabbix Agent Service box and enter the IP Address of your Zabbix Server. For Hostname, enter the FQDN of your pfSense firewall. Fill the rest like in the screenshot below.
Step 3 – Adding Firewall Rules
Now we need to add a firewall rule to allow the pfSense <-> Zabbix connection. Head to Firewall -> Rules -> LAN. Add a new rule allowing traffic from your LAN Network to your Zabbix Server on port 10050.
Step 4 – Adding pfSense to Zabbix
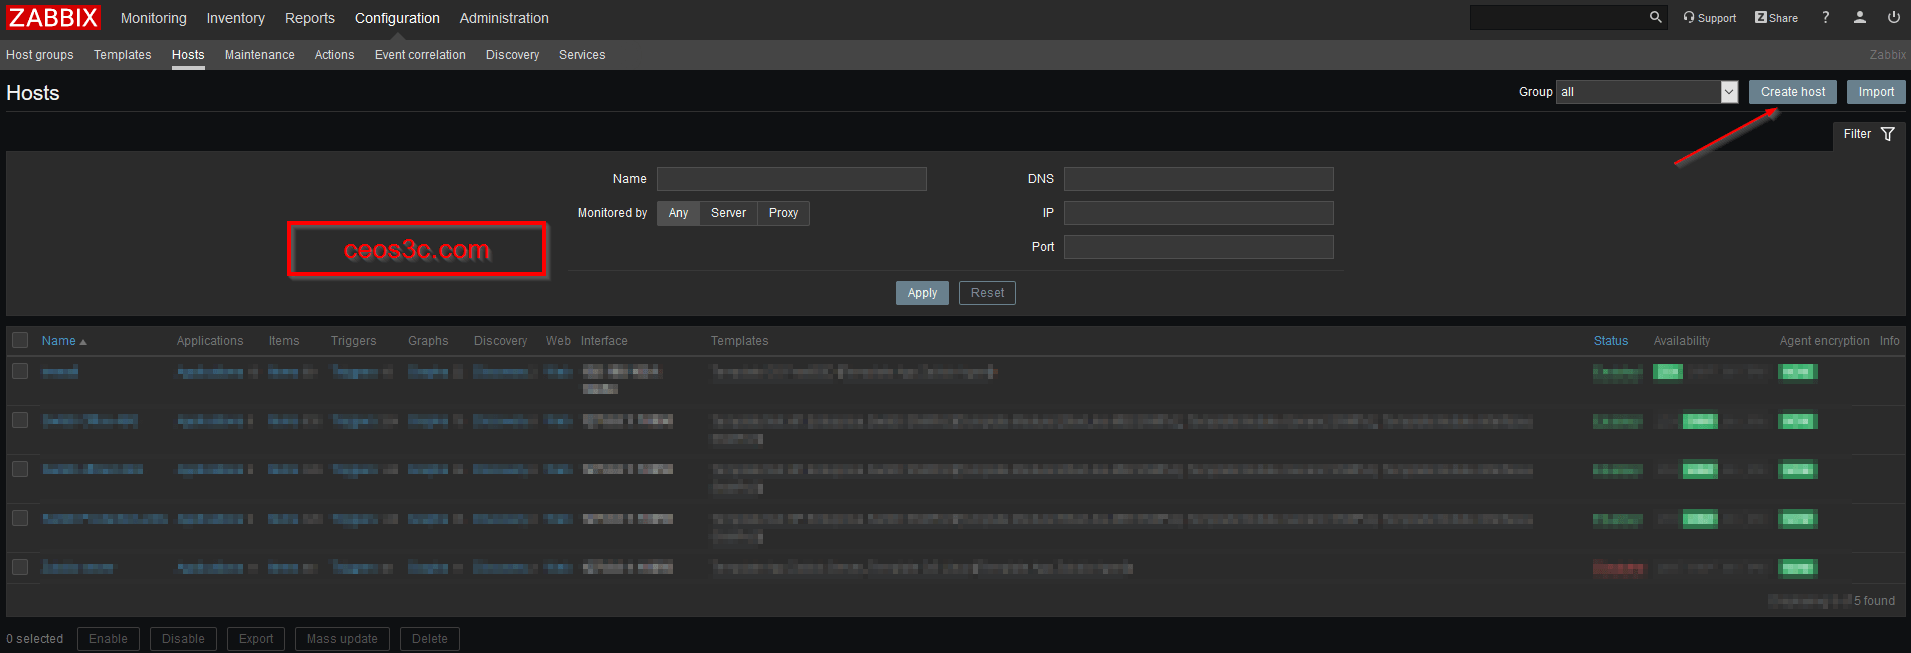
To Monitor pfSense with Zabbix, we now need to integrate it into our Zabbix server. Log in to Zabbix and navigate to Configurations -> Hosts -> Create Host.
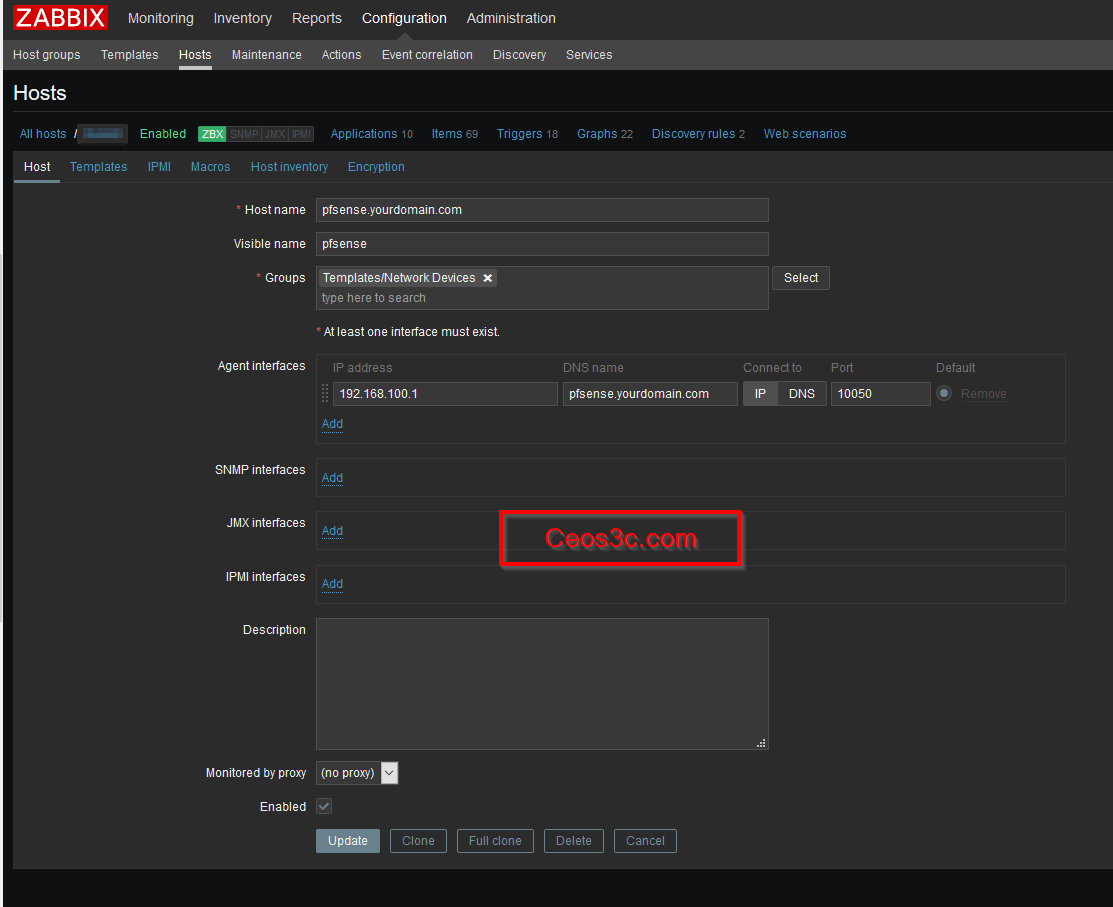
Next, enter the IP Address or the FQDN of your pfSense firewall. For visible Name fill in what name you want to see in your Zabbix Dashboard associated with your pfSense firewall. Add the appropriate group. I have chosen Templates / Network Devices.
On Agent, interfaces click on Add and enter the IP of your pfSense and the FQDN of your pfSense. Click on Update.
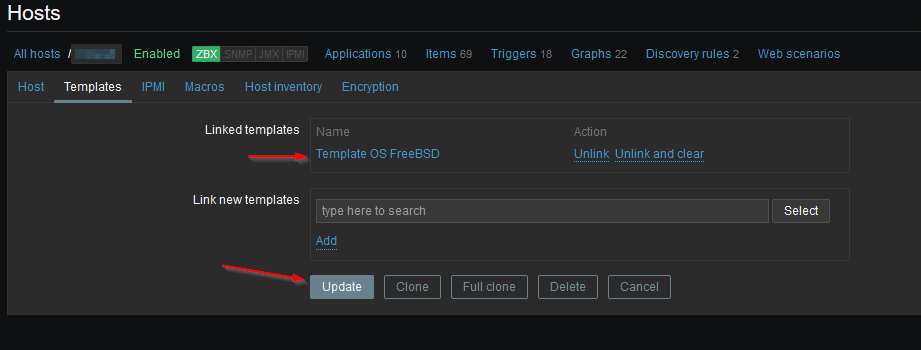
Head over to the Templates Tab and link a new Template. Choose Template OS FreeBSD, click on Add and click on Update. Once you are done with that, it might take a few minutes for the stats to populate.
Step 4 – Monitor pfSense with Zabbix
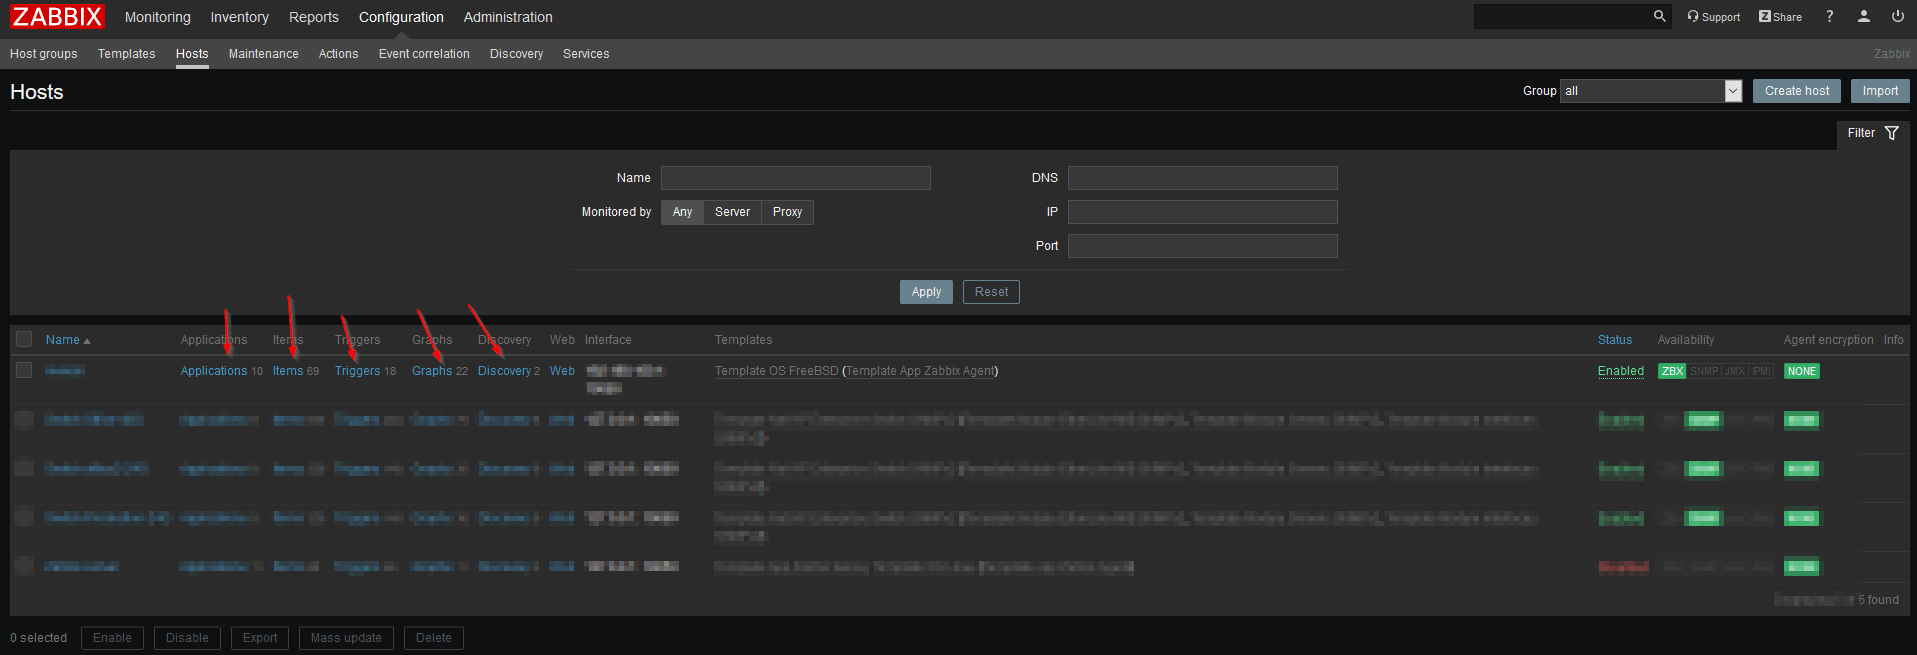
Once everything is done, head back to Hosts and you will see your firewall showing up with all its Applications, Items, Triggers, Graphs, etc. Click on Graphs to see a different kind of graphs and verify that the connection is working.
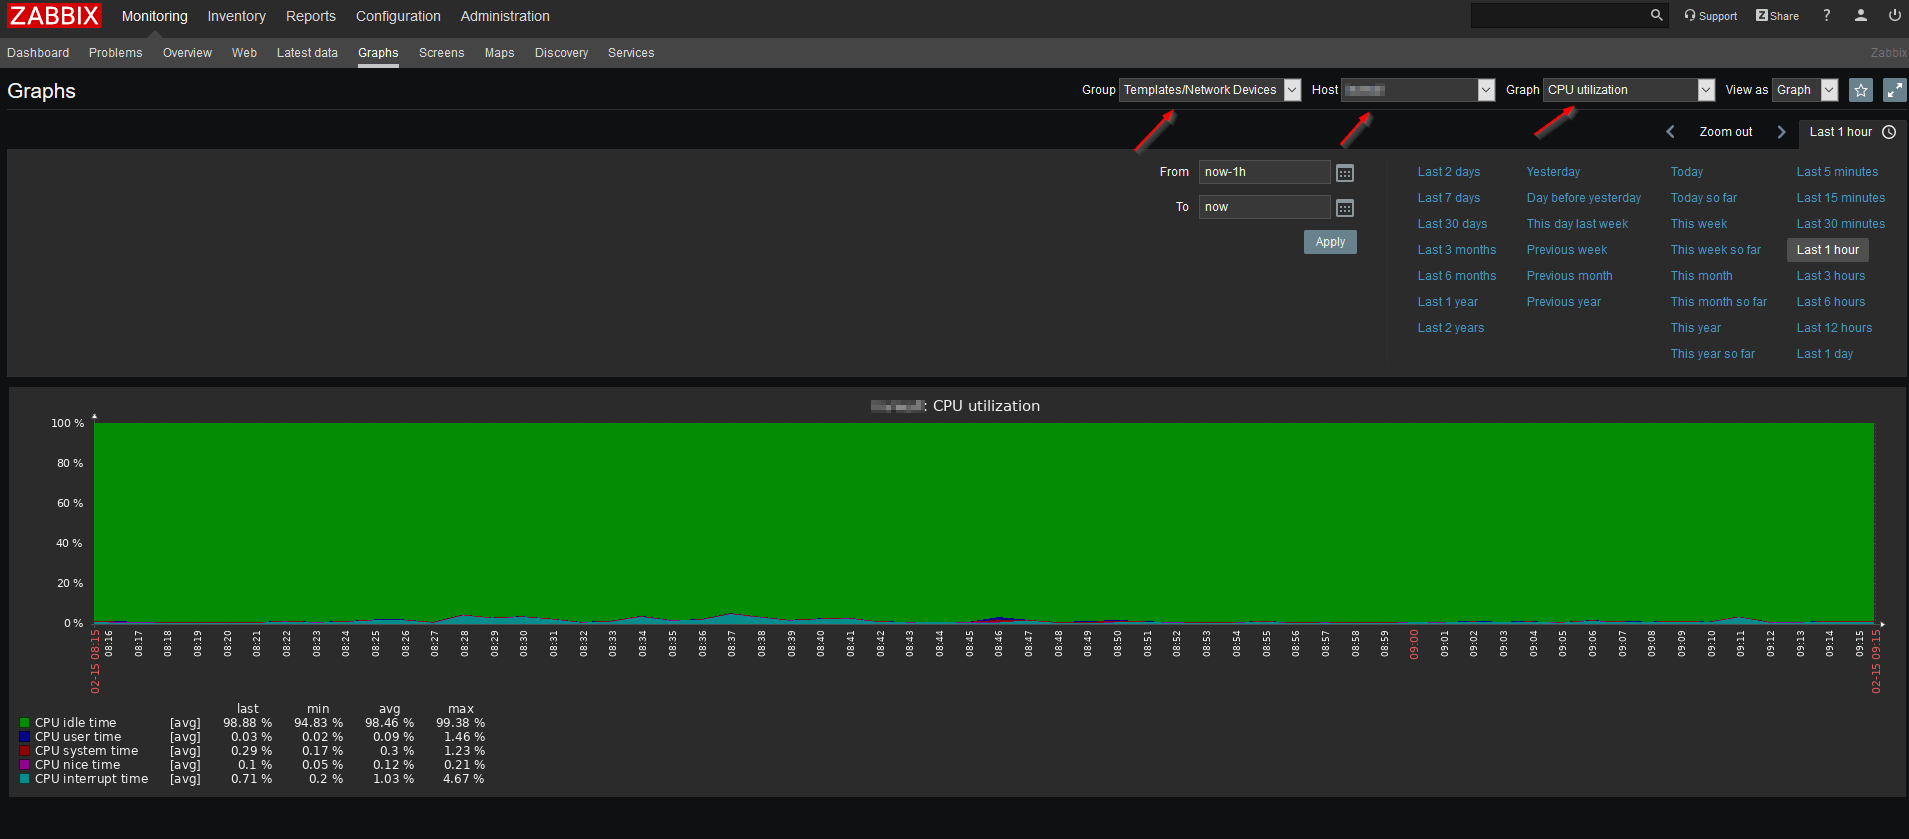
Navigate to Monitoring -> Graphs and select your pfSense firewall and a graph you want to see from the top menu. If you have done everything correctly, your graph should show some data like in the image below.
Conclusion
Gladly it’s pretty easy to Monitor pfSense with Zabbix nowadays. In just a few steps you are ready to go! Next, we are going to look at integrating our pfSense Graphs to our Grafana Dashboard!
Had the same issue on Zabbix 4.4.
Network interfaces and filesystem devices are detected through “Discovery Rules” per default for each hour.
You can mannualy trigger to detect them: Hosts->*your-pfsense-host*->Discovery Rules->*choose roole*->check now
Afterwards your pfsense interfaces are detected and show up under graphs.
Easy step-through, thanks! Also, indeed, it looks like the FreeBSD template only has five graphs.
Thank you!
Thanks for the detail you provided here. But I have a question regarding the Zabbix template you used. Did you customize yours to get the 22 graphs or use it with with a combination of multiple templates to get them? As the one I could get off the Zabbix repo only has 5 graphs (Template OS FreeBSD)
Hi there,
as far as I remember I did not customize anything 🙂