As you probably already have recognized, we have worked a lot with monitoring lately. This article will build upon that as well. We are going to monitor HP Switch with Zabbix via SNMP. I’ll take you through the process.
Zabbix is a very popular and well-known enterprise monitoring solution that helps you keep track of your network devices. In this example, we use the HP 1820 Switch Series. It is quite easy and fast to set that up.
If you need to install Zabbix first, I got you covered.
Table of Contents
Step 1 – Enable SNMP on the Switch
Before we can monitor an HP Switch with Zabbix, we need to enable SNMP on the Switch itself. Log in to your HP Switch via Web Interface. Navigate to Setup Network / Get Connected. Enter everything as below. The Community Name is basically an identifier, like a workgroup or domain. So you can use it to identify your switches. Be careful; it’s case-sensitive!
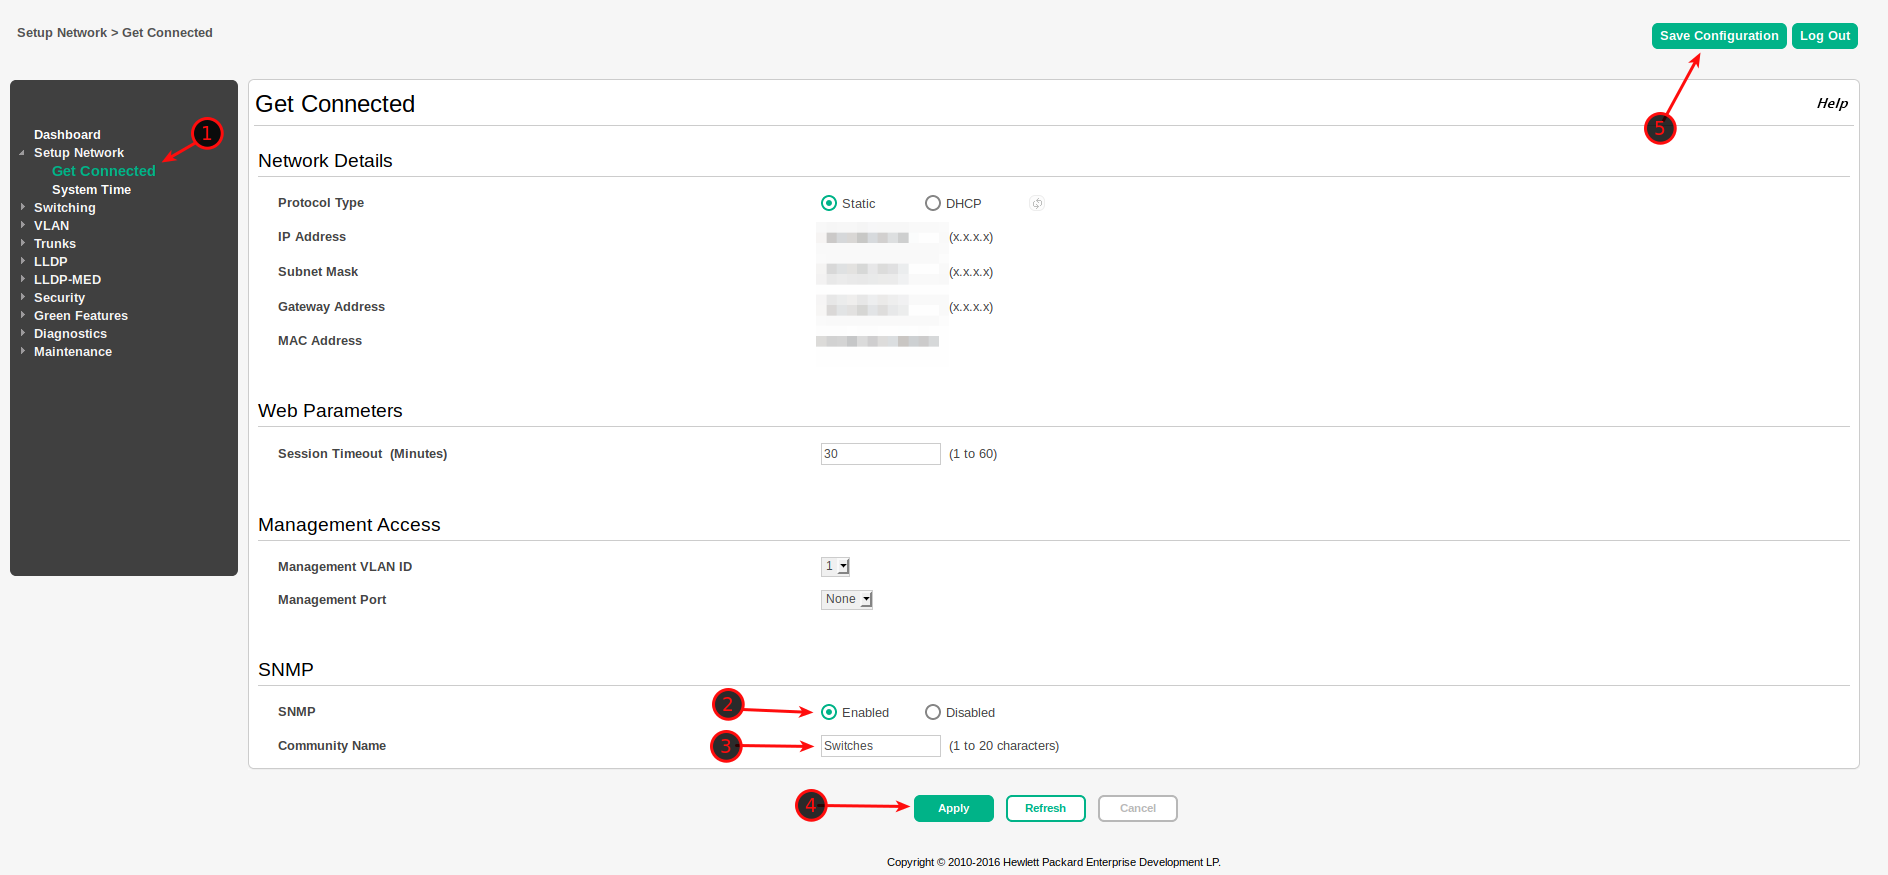
Click on Apply and Save Configuration once you are done with this.
Step 2 – Adding the Switch to Zabbix
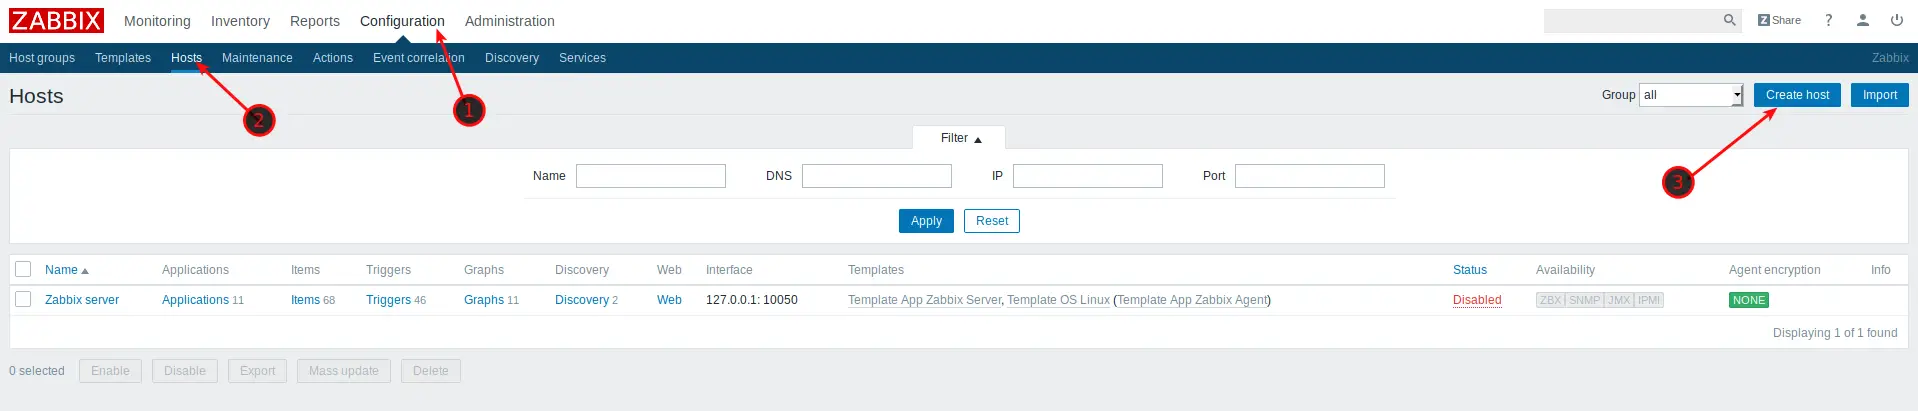
Now we need to add the Switch to Zabbix. Log in to Zabbix and navigate to Configuration / Hosts and click on Create Host.
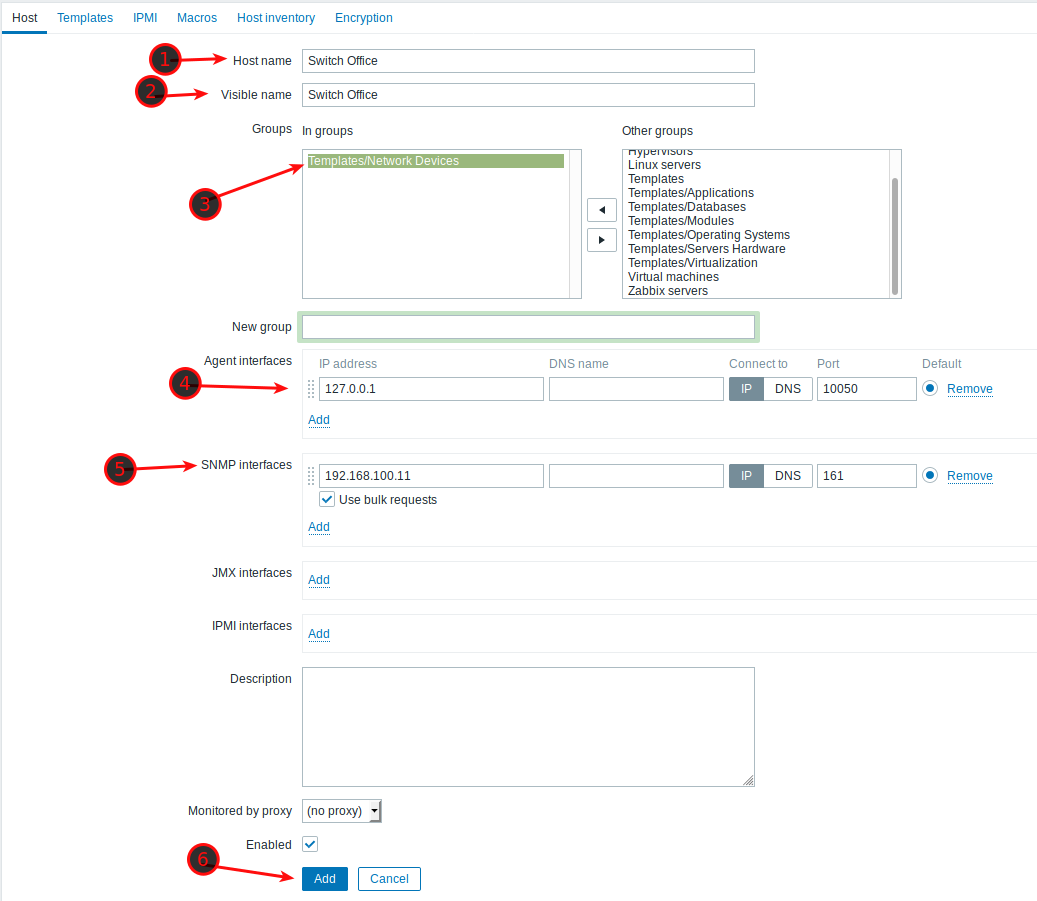
Now fill everything as in the screenshot below. Give the Switch a name, add it to a Group, add an SNMP Interface and click on Add.
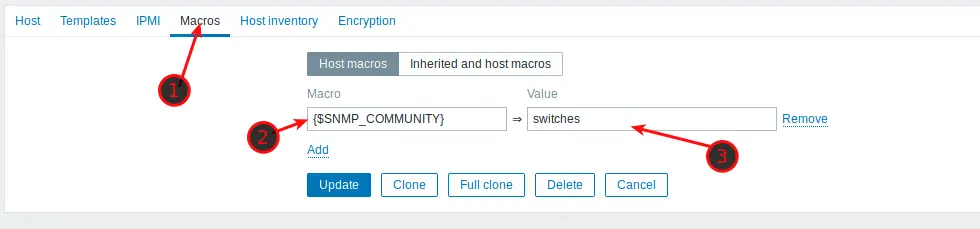
Navigate to Macros next. As a value, enter whatever you specified as the Community Name on the switch. Again, it’s case-sensitive!
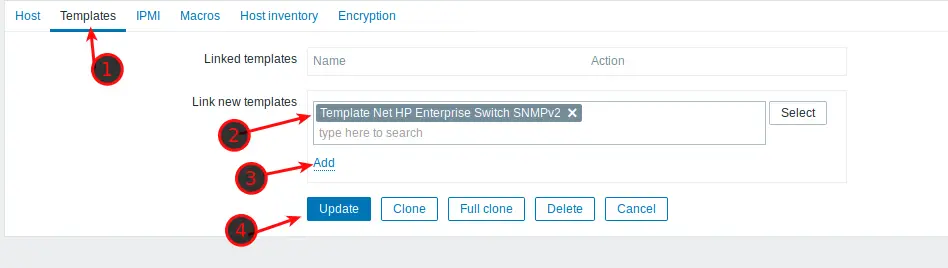
As a final step, we need to assign the proper Template to the Switch. Navigate to Templates and search for the Template: Net HP Enterprise Switch SNMPv2. Click on the small Add button below it, and finally, click on Update.
If you did everything correctly and you Navigate back to Configuration / Hosts, you should see that next to your Switch a couple of numbers are popping up. That indicates that the connection works. If there are no numbers, there is something wrong.
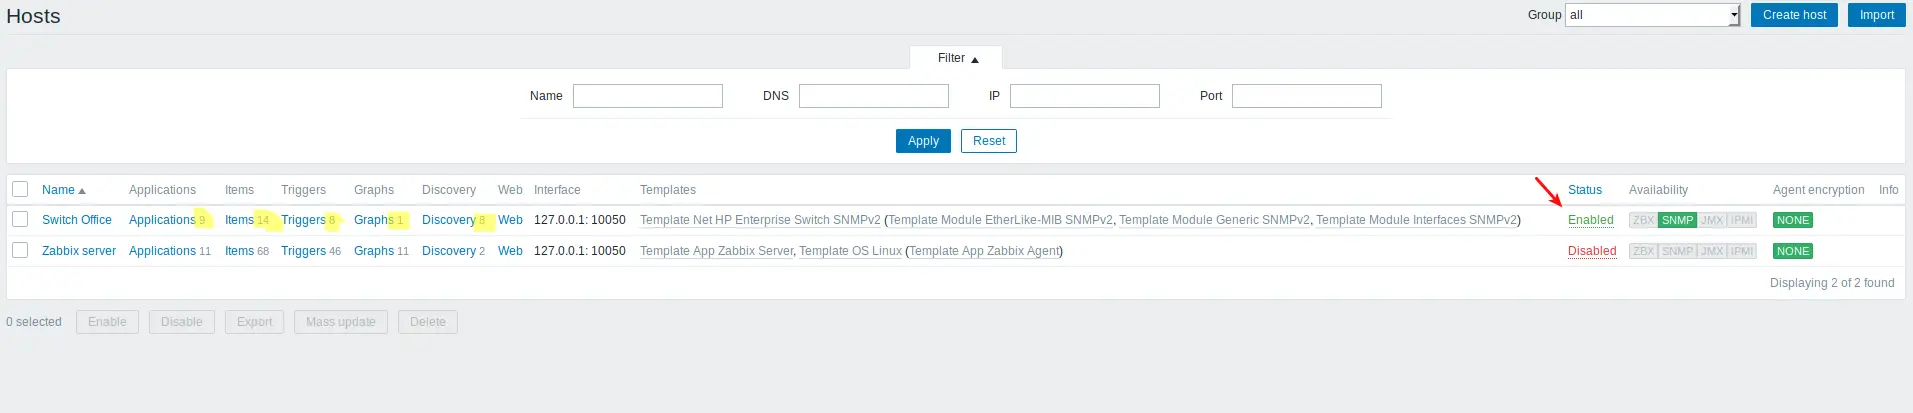
Be aware that it can take around 1 hour until all metrics are pulled and working. So give it some time to populate.
Wrapping Up
As you can see, it was pretty easy to monitor an HP switch with Zabbix. The setup is fairly quick. If you have more switches, I recommend adding them the same way.
Hi Stefan
I posted a reply a couple days ago about how putting 127.0.0.1 for agent might be wrong but I’m going to backtrack on that. The problem is with ICMP Ping and other items is it uses this agent address and so you ping the Zabbix server itself and I suggested not doing this but causes SNMP network discovery to fail. My other solution which is the change the items to use the SNMP interface is better but there is no easy way to copy or clone these changes to all devices and with 3 items and 300 hosts I needed a better way. Couldn’t find a way to do it by changing items templates either. Change graph tempaltes and copy graphs works and once that is done it is possible to make changes to Zabbix database directly, like so.
#!/usr/bin/perl

# Debian apt       : apt-get install libdbi-perl

# Debian apt       : libclass-dbi-mysql-perl
require("/root/bin/connect.pl");
$dbh = &connect_db("", "", "zabbix");
$table = "interface";
# interfaceid | hostid | type | ip | port
$sth = $dbh->prepare("select interfaceid,hostid,ip from $table where type='2' and port='161'");
if ($sth && $sth->execute() > 0 && $sth->{'NUM_OF_FIELDS'}) {
while (my $r = $sth->fetchrow_hashref()) {
my $ifid = $r->{'interfaceid'};
my $hostid = $r->{'hostid'};
my $do = "update items set interfaceid='$ifid' where hostid='$hostid' and name RLIKE \"ICMP*\"";
print "TESTING:$do\n";
#eval { $dbh->do($do); };
# print "MySQL Error: $@\n" if $@;
}
}
if ($sth) { $sth->finish(); }
$dbh->disconnect();
exit;
Hi Stefan
I installed Zabbix a year ago but didn’t use it and while learning how to use an Aruba switch I found your tutorial here fantastic. After this quick setup I went and migrated our company Cacti data to Zabbix but after a week noticed some strange behavior. Part of it is network and part is I believe Zabbix setup is incorrect. Agent interface should be the IP address of the remote machine being monitored. Why? Because I always get ping graphs from machines that are not responding to pings when I use ICMP prebuilt items to make a graph. The most appropriate fix is to use the remote IP for both Interface-Agent and Interface-SNMP not the localhost 127.0.0.1 IP for Interface-Agent. The other solution and probably the wrong fix for Ping anyway is to switch the default Item Host to the Interface-SNMP for each ICMP Ping, Ping loss, Ping response time. 127.0.0.1 only works for the Zabbix Server itself.