When it comes to Cost Optimization in AWS, you probably will hear the term Grafana at some point. To be quite frank, I haven’t seen any metrics tool that looks as beautiful as Grafana. In this tutorial, you will learn how to use Grafana with AWS CloudWatch. If you haven’t installed Grafana yet, I got you covered.
The most important part of Cost Optimization is to have proper metrics in place so that you can see which applications or servers are over-specced and therefore can be downsized or even shut down at certain times.
You could only use CloudWatch for that, but Grafana provides beautiful metrics and dashboards, that you can use to show off in your next IT meeting. But let’s get right into the installation. For this Tutorial, we assume that you have your Grafana Server installed on AWS EC2.
There are 3 ways of using Grafana with AWS CloudWatch:
- Using the ARN number of the IAM Policy
- Using a Credentials File
- Just entering the Credentials in your Data Source
In this tutorial, we will use the Credentials File Method.
Table of Contents
- Step 1 – Creating a new Policy
- Step 2 – Creating a Role
- Step 3 – Creating a User
- Step 4 – Attaching the Policy to the Grafana EC2 Instance
- Step 5 – Creating an Access Key
- Step 6 – Creating a Credentials File
- Step 6 – Use Grafana with AWS CloudWatch
- Wrapping Up
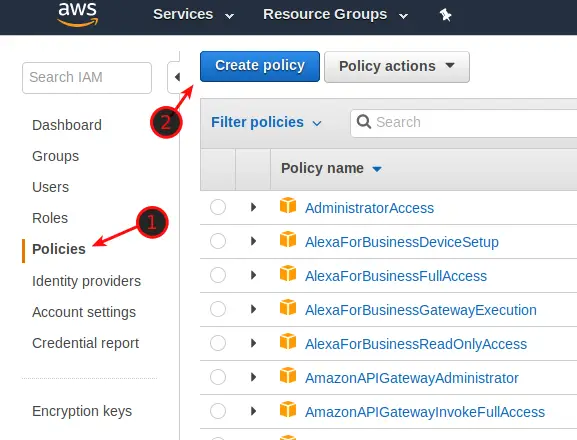
Step 1 – Creating a new Policy
Log in to AWS and navigate to IAM. Click on Policies and click on Create Policy.
Select CloudWatch as a Service and then tick ListMetrics, GetMetricData, and GetMetricStatistics. Click on Review Policy.
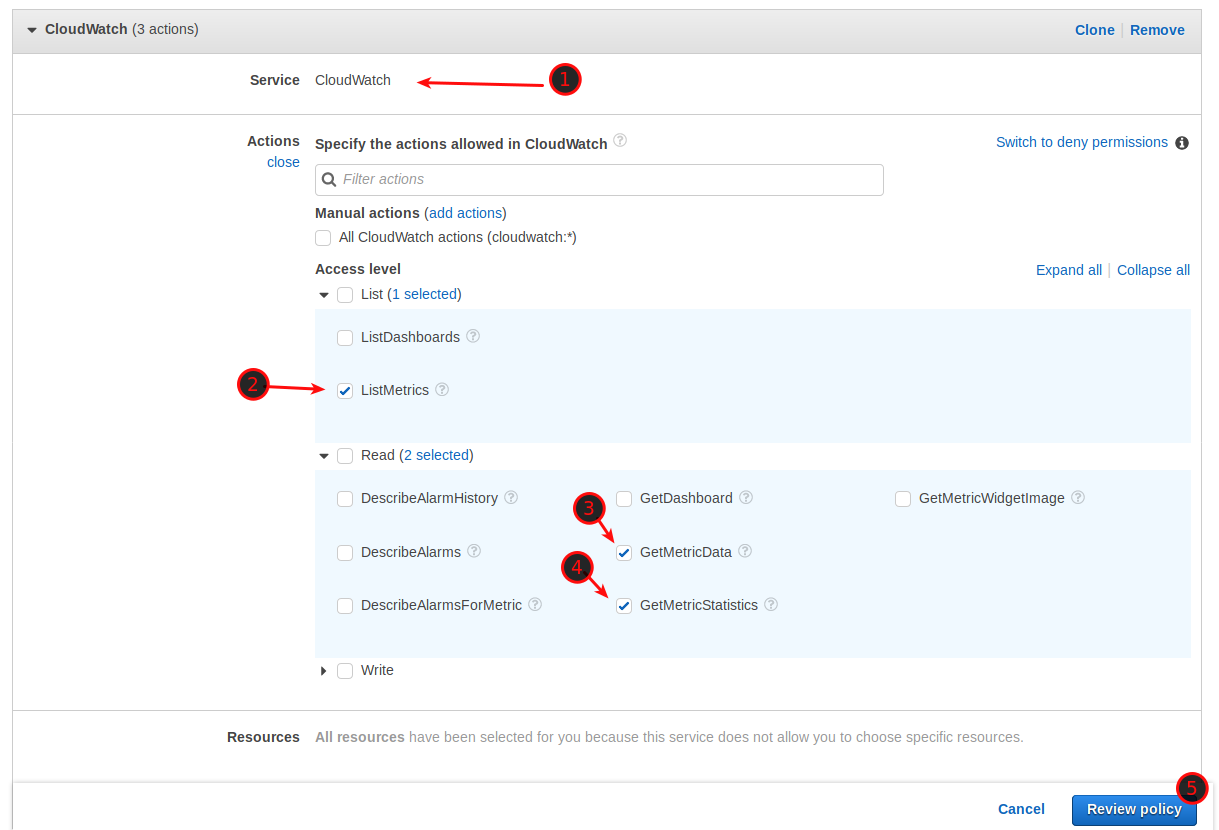
Give the Policy a Name and click Create Policy.
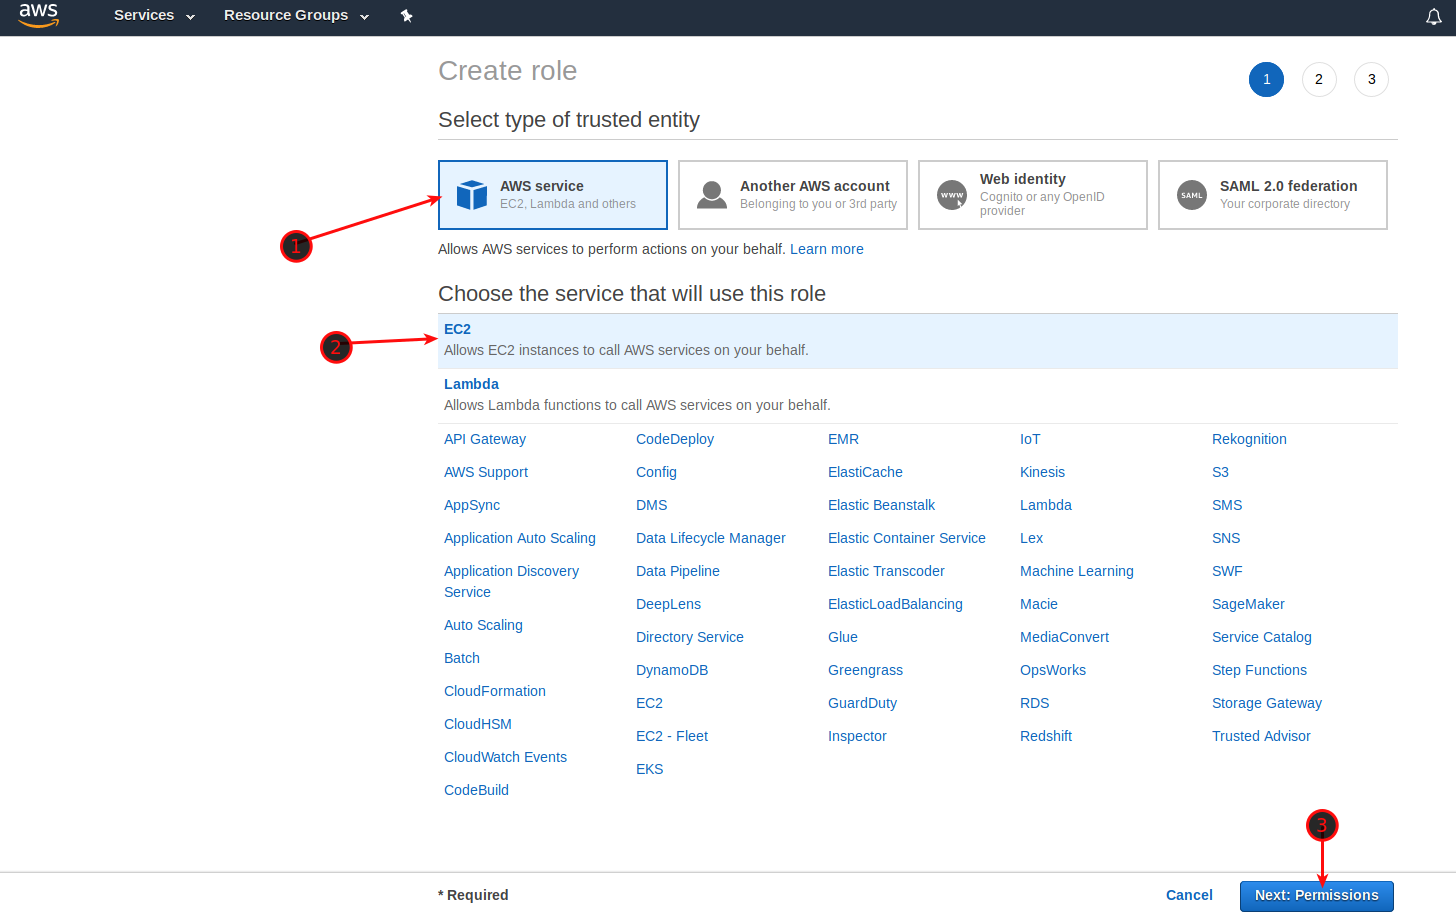
Step 2 – Creating a Role
Now we need to create a new Role and attach the Policy to it. Navigate to IAM -> Roles. Click on Create Role and select AWS Service / EC2, click Next: Permissions.
Now type Grafana in the search field and tick the box. Click on Next: Review.
Give the Role a name and click Create Role.
Step 3 – Creating a User
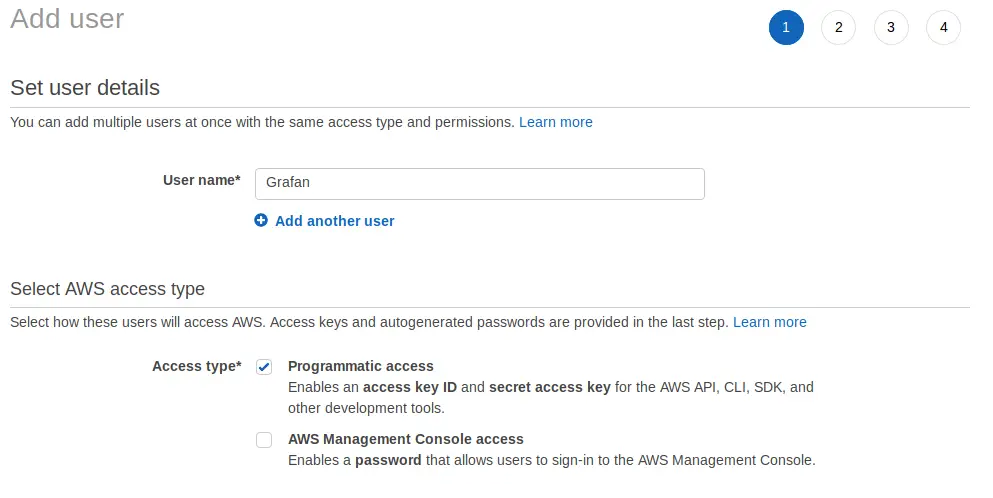
Now we need to create a user to attach the role to him. Navigate to IAM -> Users and click Add User. Give the User a name, something like Grafana or Monitoring, and select Programmatic Access. Click Next: Permissions.
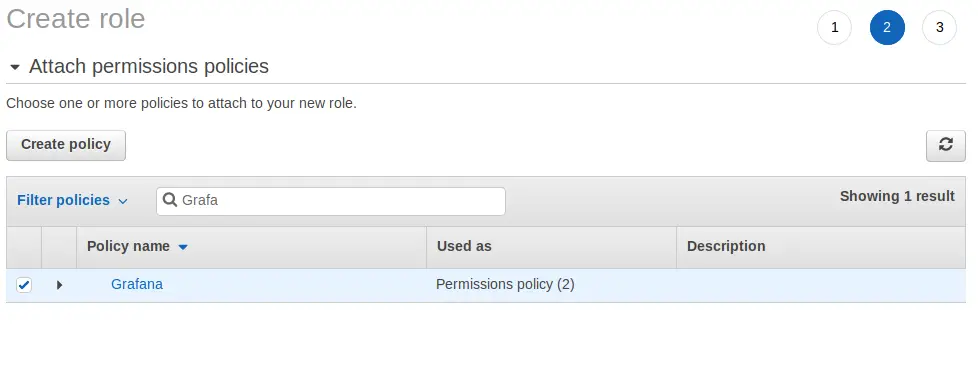
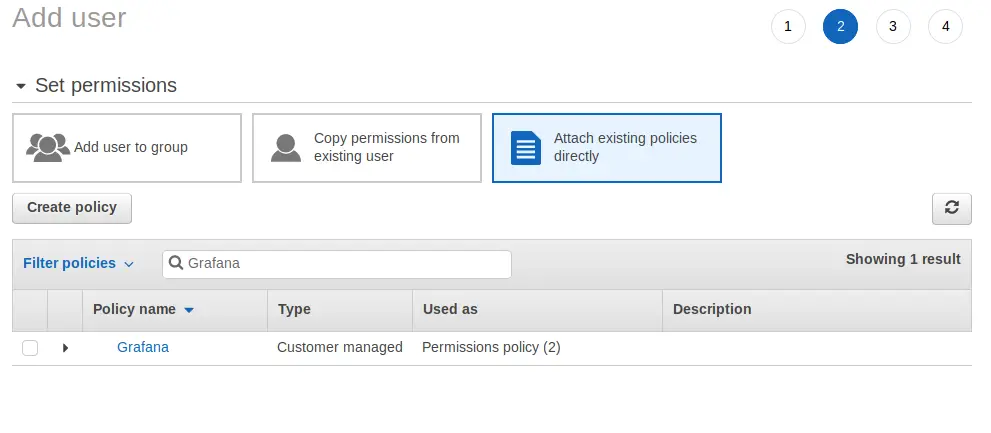
Select Attach existing policies directly and choose your Grafana Policy. Click Next: Review.
Step 4 – Attaching the Policy to the Grafana EC2 Instance
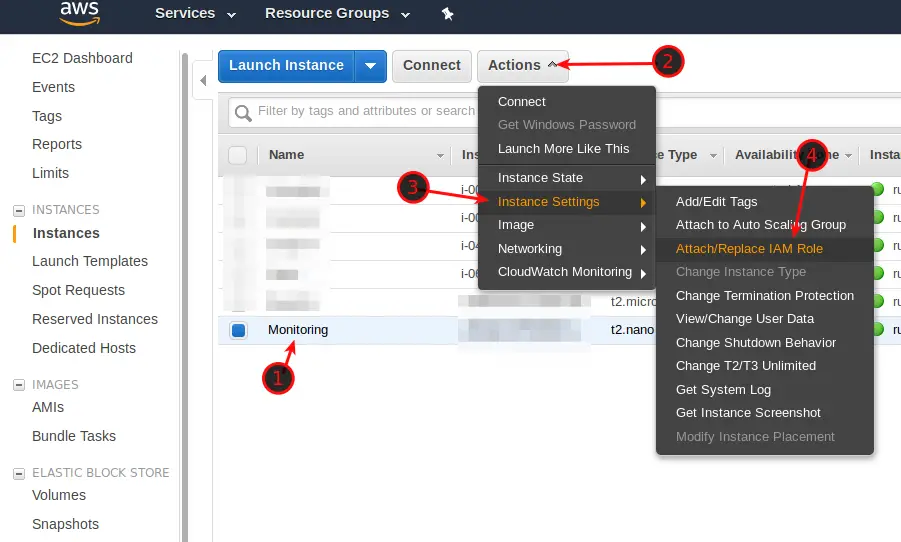
Now, we need to attach the Policy to our Grafana EC2 Instance. Navigate to EC2 -> Instances. Select your Grafana Server and click on Actions -> Instance Settings -> Attach/Replace IAM Role. Attach your Grafana IAM Role to the instance.
Step 5 – Creating an Access Key
Now we have to configure Grafana. But first, we need to create an Access Key in AWS. Navigate to IAM -> Users. Select your Grafana User and click on Security Credentials. Click on Create Acces Key and leave the window open, we will need it in a moment.
Step 6 – Creating a Credentials File
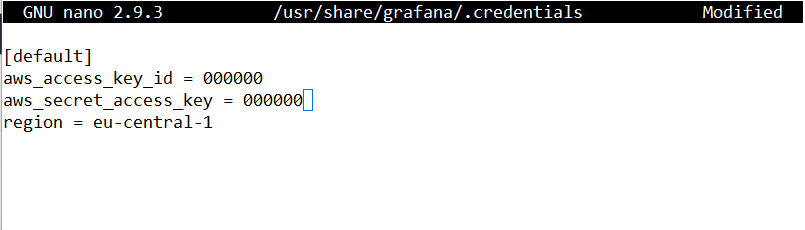
Almost done. Log in to your Grafana Server via Terminal and run the following command:
sudo nano /usr/share/grafana/.credentialsNow enter your Access Key ID, your Secret Key, and your Region as in the example below. Of course, replace the zeros with your own keys. Save with CTRL + O and leave the file with CTRL + X.
Now we just have to give it the right permissions:
sudo chmod 0644 .credentialsCode language: CSS (css)And we are golden.
Step 6 – Use Grafana with AWS CloudWatch
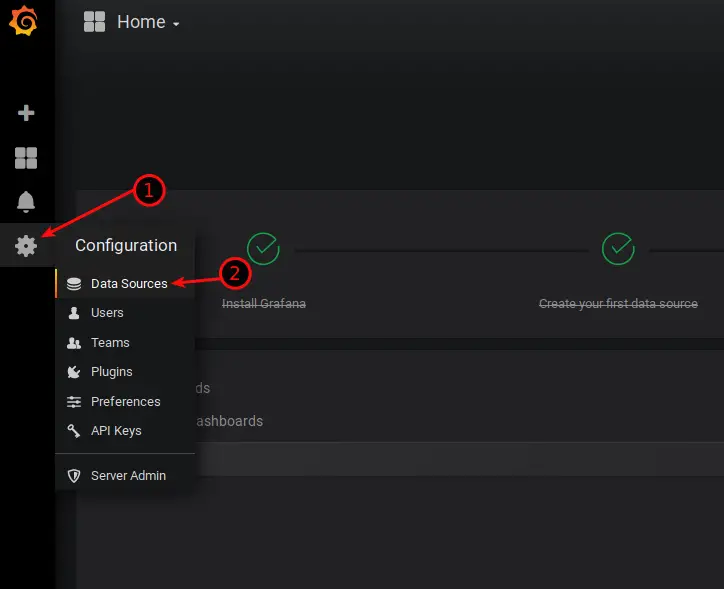
Final Step! Now we need to connect Grafana to AWS CloudWatch. Log in to Grafana, Navigate to Data Sources.
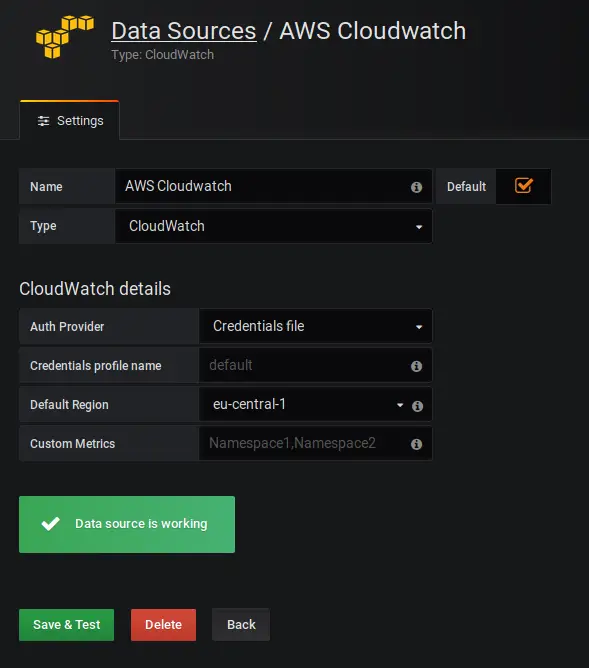
Give it a Name, as Type select CloudWatch. For Auth Provider, choose Credentials File. Select your Default Region and leave Credentials Profile Name on default. Once you have done that, click on Save & Test and you should be presented with a Green “Data Source is working” message.
In case it doesn’t work, try to provide the path to your .credentials file in the Credentials Profile Name field like: /usr/share/grafana/.credentials
If you have followed all steps carefully, you should now be able to use Grafana with AWS CloudWatch. Should you run into any problems, always make sure to check the Official Documentation. The log files are also often a good indicator of what’s not working. They can be found by typing:
sudo cat /var/log/grafana/grafana.logCode language: JavaScript (javascript)Wrapping Up
I am just at the beginning of understanding how Grafana works and I already see how powerful a tool it is. There will be definitely more tutorials on Grafana, like setting up your Dashboard, creating Dashboards, and which metrics are worth following. So stay tuned for that, the best way to stay up to date is by subscribing to the Weekly Newsletter.
I would say yes. That way you have temporary credentials assigned to the instance where grafana is running.
AWS SDKs follow this hierarchy when trying to find credentials (some have more):
1 – Environment variables (AWS_ACCESS_KEY_ID and AWS_SECRET_ACCESS_KEY)
2 – File – typically located at ~/.aws/credentials (location can vary per platform) (read more here: https://docs.aws.amazon.com/cli/latest/userguide/cli-config-files.html). Very useful to assume different “roles” (with different permissions) having the same set of KEY and SECRET.
3 – Amazon ECS container credentials.
4 – Instance profile credentials– used on EC2 instances, and delivered through the Amazon EC2 metadata service. The AWS SDK for Java uses the InstanceProfileCredentialsProvider to load these credential
Ideally you would avoid creating new AWS_ACCESS_KEY_ID and AWS_SECRET_ACCESS_KEY as those are easier to loose (or forget to delete them). Even when you generate these, they should have the least permissions possible and one of the permissions would be for you to be able to assume a more powerful role (kinda like a sudo).
In this specific case, you can just create an instance profile (https://docs.aws.amazon.com/IAM/latest/UserGuide/id_roles_use_switch-role-ec2_instance-profiles.html) and attach it to the instance and grafana will “load them” when needed.
Ps:. I can’t use the “reply” button. Sorry for the new comment :/
Paulo, thanks for the lengthy explanation! That sounds like it makes sense for sure. I will look into it when I get around to it and eventually add it to the guide as an alternative! Thank you!
Wouldn’t an instance profile be better?
Paulo, IDK, would it?